Develop for Camunda Version 5.45.0
Supercharge Your Camunda Modeler with Real‑Time Performance Insights!
Are you ready to take your Camunda experience to the next level?
Our innovative plugin brings powerful diagnostic tools directly into the Modeler, giving you instant visibility into performance, network behavior, and system responsiveness — all without leaving your workflow.
Key Features:
-
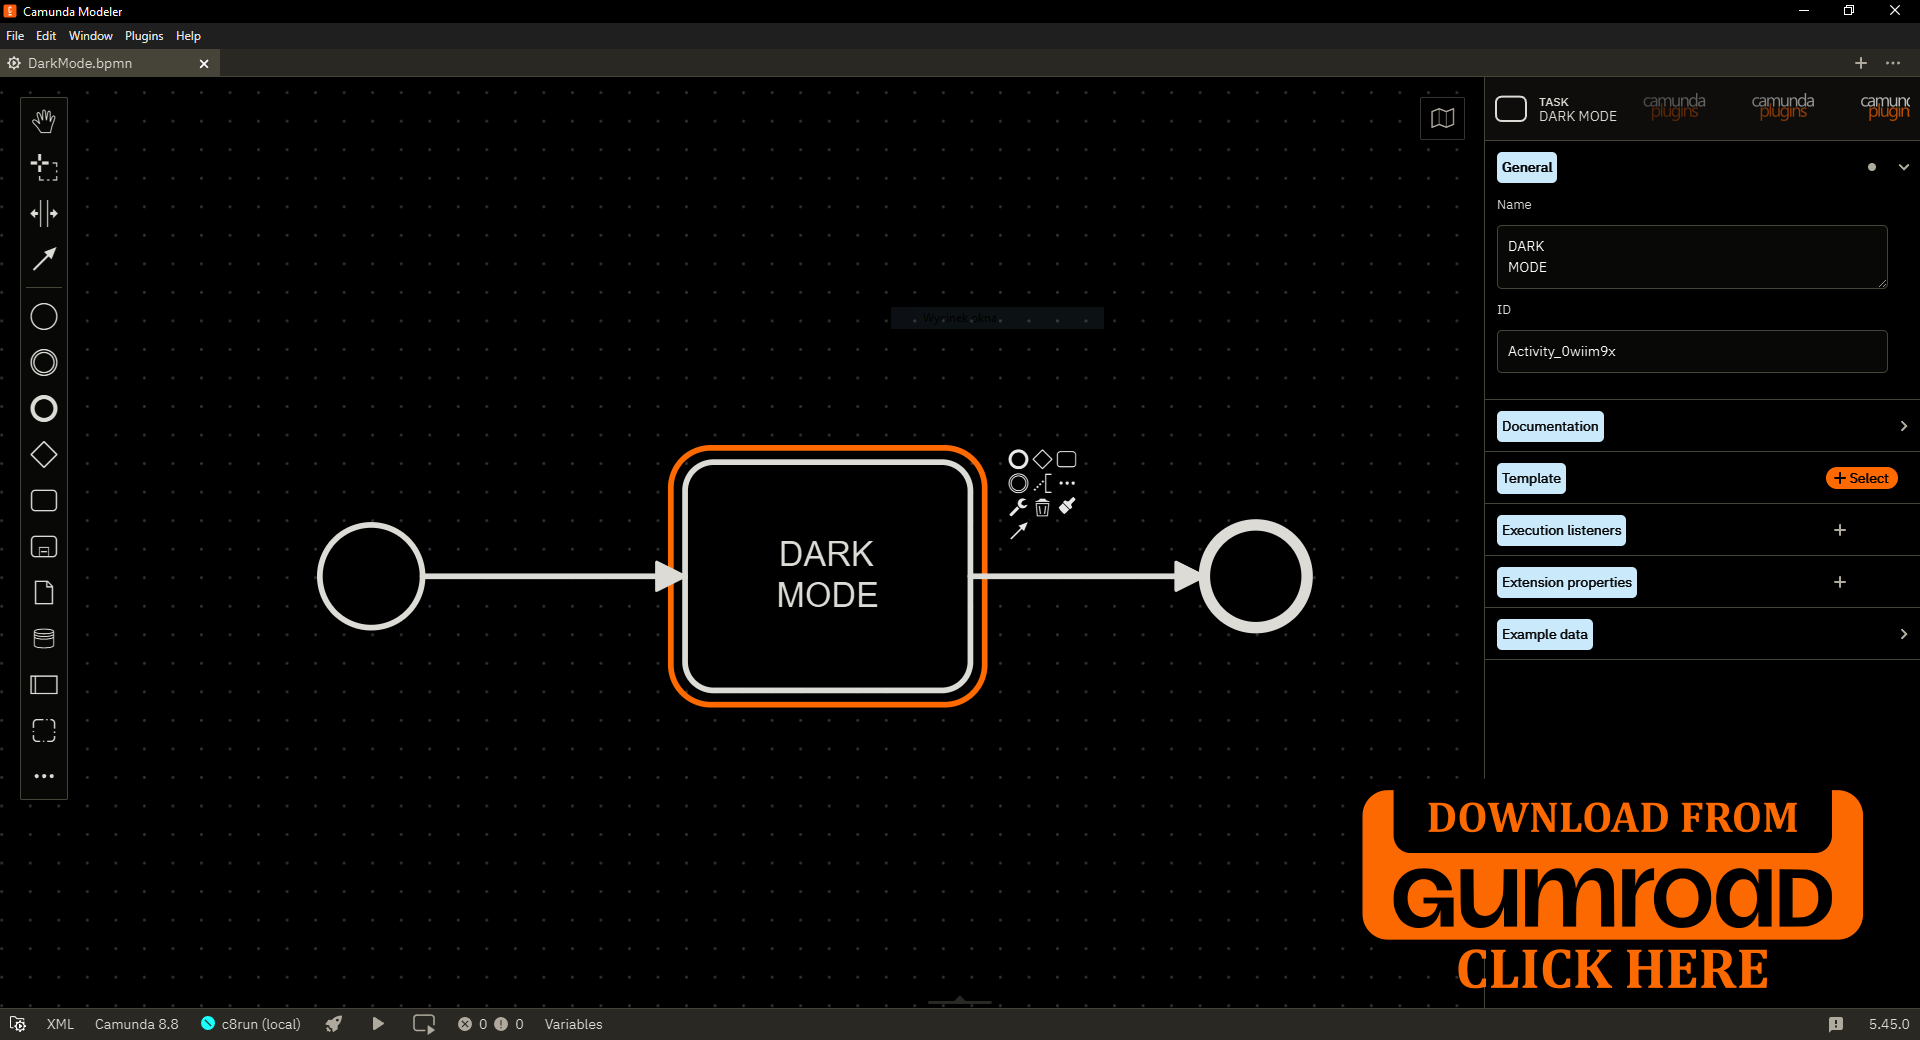
Real‑Time Performance Monitor:
Stay informed with a live dashboard that tracks essential metrics such as FPS, UI lag, freeze detection, network status, active requests, and user activity. This gives you a clear picture of how the Modeler behaves at any moment.
-
Network Health Tracking:
Monitor ping, maximum latency spikes, and request timeouts to quickly identify connectivity issues that may affect your modeling experience.
-
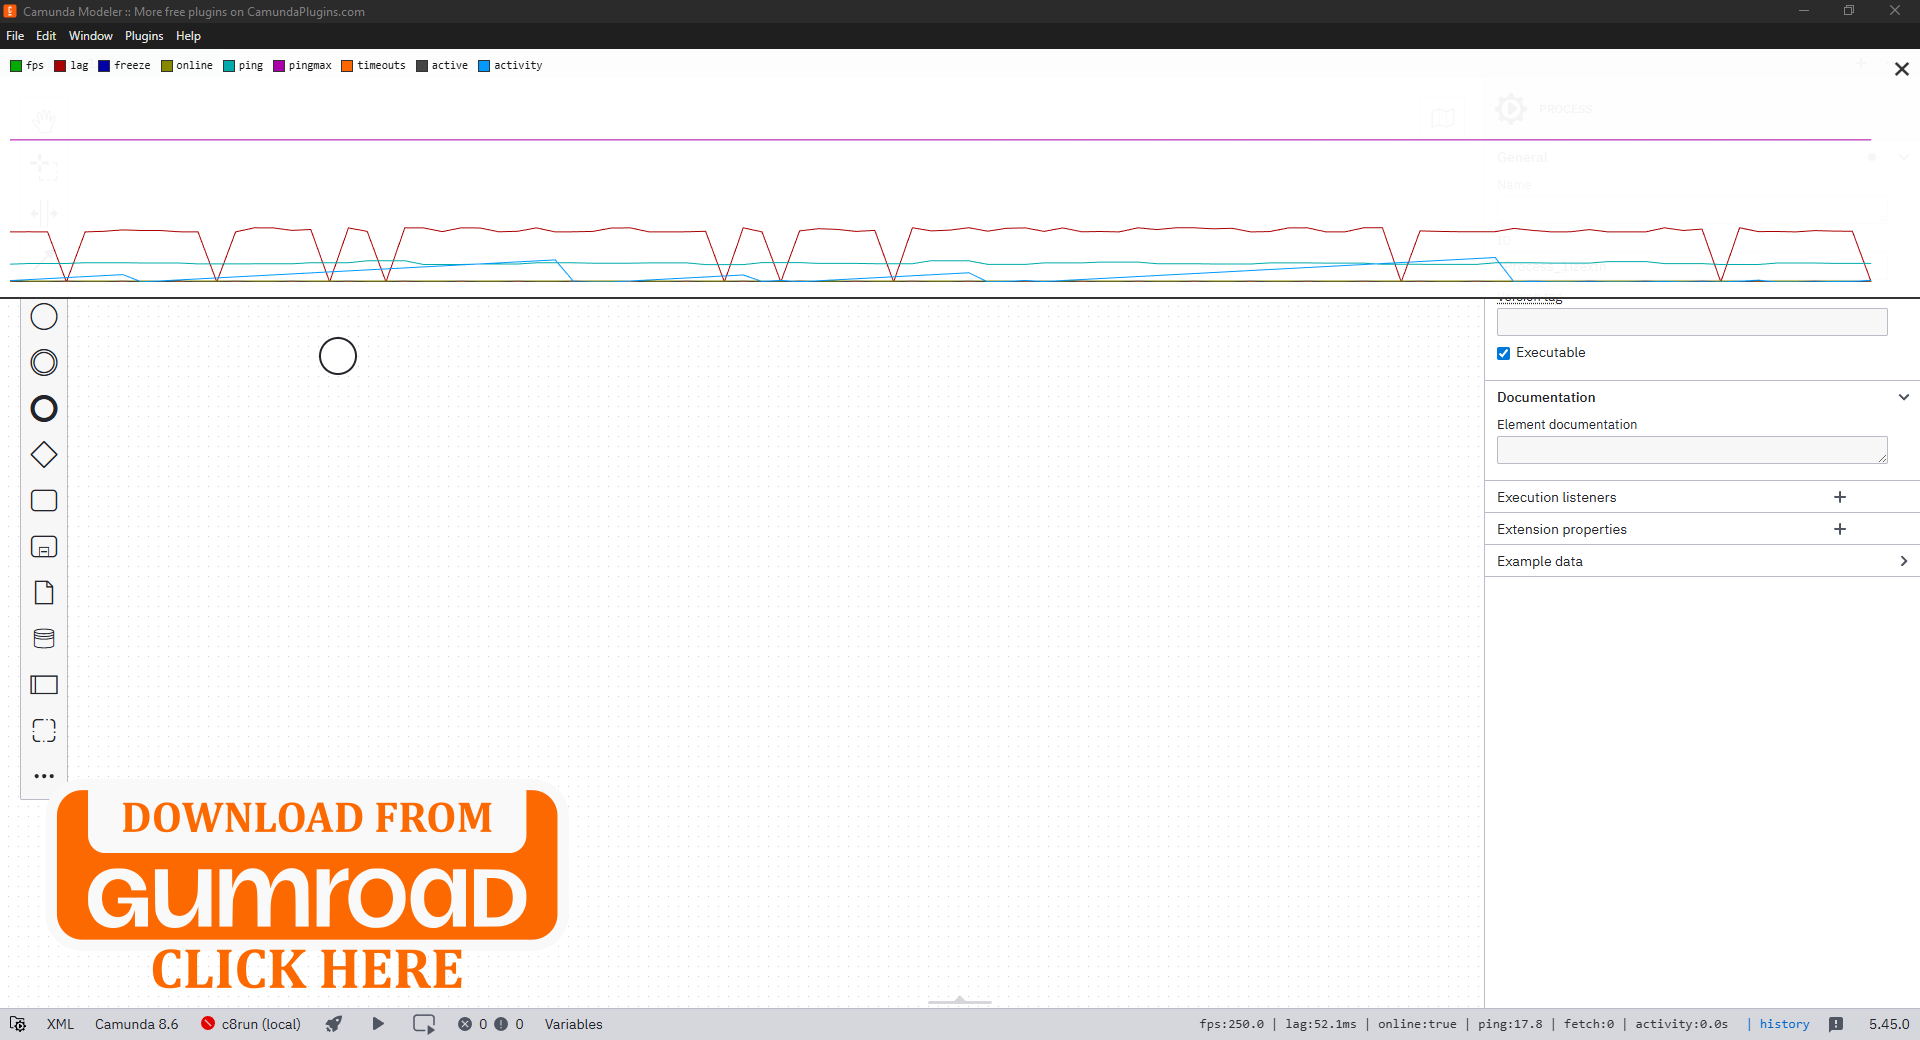
Historical Analytics Panel:
With a single click on the History button, access a beautifully chart.
The panel includes a multi‑metric line graph, smooth real‑time updates, and an easy open/close toggle.
Perfect for spotting trends, diagnosing slowdowns, and understanding performance over time.
Why Choose This Plugin?
Investing in this plugin means investing in clarity, stability, and efficiency.
Whether you're developing plugins, working with large BPMN/DMN models, or simply want deeper insight into how Camunda performs on your system, this tool empowers you with the data you need.
Transform your workflow with real‑time diagnostics, intuitive visualizations, and a seamless user experience.